Oscilloscope Primer
An oscilloscope enables us to display the measured voltage with respect to time. Some of them can show multiple waveform signals. The waveforms can be different due to the voltage sources. The frequency or period and the amplitude of voltages can be read from the display. In 1897, the behavior of cathode ray indicated the varying voltage on the fluorescent screen in Germany. In 1934, the US company, DuMont commercialized the technologies as an oscilloscope.
Go Back to Hiro's Physics Main
Contents
 The display can be an analogue or a digital type. The analogue one uses Cathode Ray Tube (CRT), while
the digital one uses Liquid Crystal Display (LCD). Although the display of a modern oscilloscope
shows many of physical/engineering values, the basic style of the display is associated with horizontal
and vertical lines, which is called the graticule. These lines are the references to measure times,
voltages, currents, etc.
The display can be an analogue or a digital type. The analogue one uses Cathode Ray Tube (CRT), while
the digital one uses Liquid Crystal Display (LCD). Although the display of a modern oscilloscope
shows many of physical/engineering values, the basic style of the display is associated with horizontal
and vertical lines, which is called the graticule. These lines are the references to measure times,
voltages, currents, etc.
 In order to measure the electrical signals, one has to have probes connected to
the BNC (Bayonet Neill-Concelman) connector on an oscilloscope.
Normally, the probe consists of two ends: One is a measuring clip colored sometimes in red; and the other is a grounding
clip colored in black. The ground is used for the reference and not for measuring the values.
In some cases, if the grounding probe touches a wrong terminal, the scope may display a wrong result.
In order to measure the electrical signals, one has to have probes connected to
the BNC (Bayonet Neill-Concelman) connector on an oscilloscope.
Normally, the probe consists of two ends: One is a measuring clip colored sometimes in red; and the other is a grounding
clip colored in black. The ground is used for the reference and not for measuring the values.
In some cases, if the grounding probe touches a wrong terminal, the scope may display a wrong result.
 Channels on oscilloscope are refered to as inputs. Each signal from each pair of probes
is measured in each chennel. An oscilloscope can measure multiple values to compare them simultaneously.
If there are two channels, it is called a two-channel oscilloscope.
Each channel has its own set of control to adujust its scale of voltage and other values.
Channels on oscilloscope are refered to as inputs. Each signal from each pair of probes
is measured in each chennel. An oscilloscope can measure multiple values to compare them simultaneously.
If there are two channels, it is called a two-channel oscilloscope.
Each channel has its own set of control to adujust its scale of voltage and other values.
 The oscilloscope can manipulate various parameters, such as scales, X-Y coordinates, screen intensity, etc.. Some of them can
use mathematical functions to transform the measured values. The control panel consists of dials, toggles,
buttons, switches, and connectors.
The oscilloscope can manipulate various parameters, such as scales, X-Y coordinates, screen intensity, etc.. Some of them can
use mathematical functions to transform the measured values. The control panel consists of dials, toggles,
buttons, switches, and connectors.
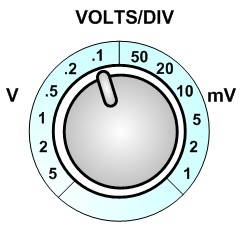
Then, according to the VOLTS/DIV control, it indicates "50 mV" as the factor of multiplication. Please watch out the units. "mV" means one thousandth of a volt.
Therefore, the peak-to-peak voltage is calculated as 3.60 div. × 50 × 0.001, which is equal to 0.18 volts.
However, this is NOT the voltage detected in the circuit yet. The amplitude of the waveform is the correspondent voltage, so 0.18 volts have to be divided by 2. The voltage amplitude is found out to be 0.090 volts or 90 millivolts.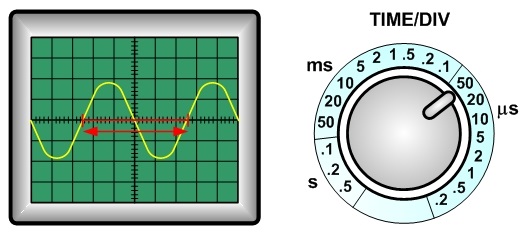
A waveform in general repeats one unit of a shape that is called a cycle. Then, the time for one cycle is defined as the period.
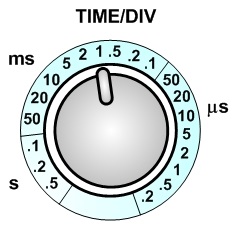
For example, you can see the period as the x-range with the red arrow in the figure. The number of division can be counted in the same way as 4.00 div. + 0.50 div(left fraction) + 0.60 div.(right fraction) = 5.10 div.
The TIME/DIV control indicates 50 micro seconds, so the period is computed as 5.10 div. × 50 × 10-6 (or 0.000001) which gives 2.55×10⁻⁴ seconds or 0.000255 seconds. (This could be rounded as 2.6×10⁻⁴ s.)
In addition, the frequency can be obtained by calculating 1 ÷ period. Thus, we have 1 ÷ 0.000255 = 3920 Hz ∼ 3900 Hz as the frequency of the signal.
 Need help?
Yes!
Contents
- Basic Parts of an Oscilloscope
- Functions of buttons and switches
- How to measure with an oscilloscope
- Practice for the voltage and period measurements
Basic Parts of an Oscilloscope
Display
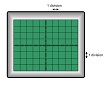
 The display can be an analogue or a digital type. The analogue one uses Cathode Ray Tube (CRT), while
the digital one uses Liquid Crystal Display (LCD). Although the display of a modern oscilloscope
shows many of physical/engineering values, the basic style of the display is associated with horizontal
and vertical lines, which is called the graticule. These lines are the references to measure times,
voltages, currents, etc.
The display can be an analogue or a digital type. The analogue one uses Cathode Ray Tube (CRT), while
the digital one uses Liquid Crystal Display (LCD). Although the display of a modern oscilloscope
shows many of physical/engineering values, the basic style of the display is associated with horizontal
and vertical lines, which is called the graticule. These lines are the references to measure times,
voltages, currents, etc.
Probes
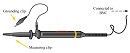
 In order to measure the electrical signals, one has to have probes connected to
the BNC (Bayonet Neill-Concelman) connector on an oscilloscope.
Normally, the probe consists of two ends: One is a measuring clip colored sometimes in red; and the other is a grounding
clip colored in black. The ground is used for the reference and not for measuring the values.
In some cases, if the grounding probe touches a wrong terminal, the scope may display a wrong result.
In order to measure the electrical signals, one has to have probes connected to
the BNC (Bayonet Neill-Concelman) connector on an oscilloscope.
Normally, the probe consists of two ends: One is a measuring clip colored sometimes in red; and the other is a grounding
clip colored in black. The ground is used for the reference and not for measuring the values.
In some cases, if the grounding probe touches a wrong terminal, the scope may display a wrong result.
Channels
 Channels on oscilloscope are refered to as inputs. Each signal from each pair of probes
is measured in each chennel. An oscilloscope can measure multiple values to compare them simultaneously.
If there are two channels, it is called a two-channel oscilloscope.
Each channel has its own set of control to adujust its scale of voltage and other values.
Channels on oscilloscope are refered to as inputs. Each signal from each pair of probes
is measured in each chennel. An oscilloscope can measure multiple values to compare them simultaneously.
If there are two channels, it is called a two-channel oscilloscope.
Each channel has its own set of control to adujust its scale of voltage and other values.
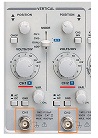
Controls and Indicators
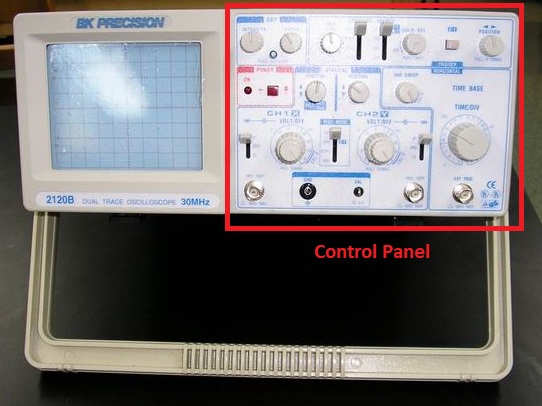 The oscilloscope can manipulate various parameters, such as scales, X-Y coordinates, screen intensity, etc.. Some of them can
use mathematical functions to transform the measured values. The control panel consists of dials, toggles,
buttons, switches, and connectors.
The oscilloscope can manipulate various parameters, such as scales, X-Y coordinates, screen intensity, etc.. Some of them can
use mathematical functions to transform the measured values. The control panel consists of dials, toggles,
buttons, switches, and connectors.
Functioning of buttons and switches
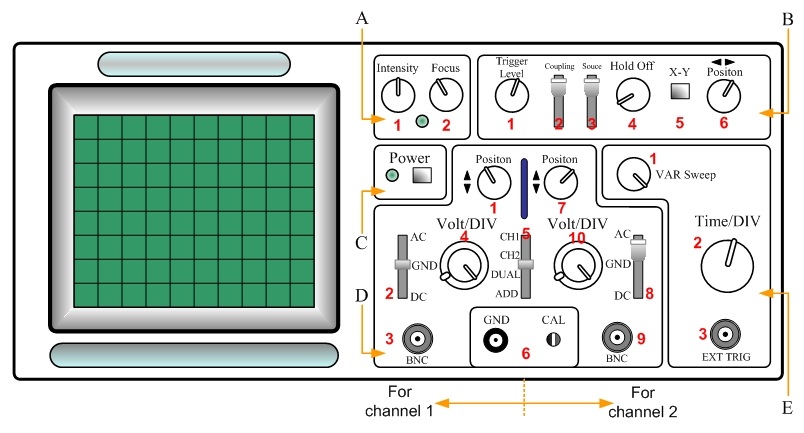
The basic structure of an oscilloscope is shown in the figure below. According to the type of control, it can be divided into several sections. In this example, there are five sections; and each button, switch, and toggle is labeled by numbers to be explained:Section A: Control for CRT
- A-1 Intensity Control This knob controls the brightness of trace in display.
- A-2 Focus Control This adjusts trace focus in display.
Section B: Control for Triggering
- B-1 Trigger level In order to stabilize the moving waveforms (sweep), use the trigger level to display the single shot of the waveform. The rotation in the negative (positive) direction chooses more negative (positive) triggering point.
- B-2 Trigger coupling switch This selects the trigger coupling from four possible positions:
- B-3 Trigger source switch This selects the source of sweep trigger with four choices:
- B-4 Holdoff control Holdoff time defines the trigger period inhibit beyond sweep duration. This knob adjusts that time.
- B-5 X-Y switch This switch is used with vertical mode (D-5) and trigger source (B-3), and lets two signals become X- and Y-axes, respectively.
- B-6 Horizontal position control This adjusts the position of a waveform in horizontal direction.
Auto: This switch chooses the triggering point automatically.
Normal: This operates the normal triggering.
TV-V: This trigggers from television vertical sync pulse.
TV-H: This trigggers from television horizontal sync pulse.
CH1/X-Y/ALT
CH1: This lets the channel-1 input become the sweep trigger.
X-Y: This is used with two inputs to enable the X-Y mode.
ALT: This permits each waveform displayed to become its own trigger source.
CH2: The signal from channel 2 becomes the sweep trigger.
LINE: The signal from line voltage (50/60 Hz) becomes the sweep trigger.
EXT: The signal from external trigger jack (E-3) becomes the sweep trigger.
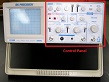
Section C: Control for power
- C Power button This turns oscilloscope on or off.
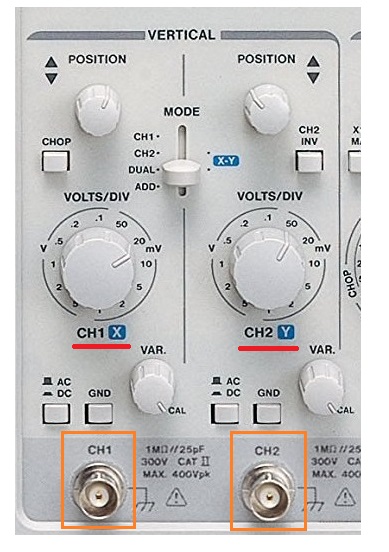
Section D: Control for input/output from channels
- D-1 Vertical position control This adjusts the position of a waveform from channel 1 in the vertical direction.
- D-2 AC-Ground-DC switch for CH1 AC: The DC component of the signal is blocked.
- D-3 Input jack for CH1 This is called BNC connector to be connected to the coaxial cable with measuring probes.
- D-4 Volts/Div control for CH1 There are two different knobs in this control. The bottom one is the attenuator to change the vertical scales of calibrator, which is often a value of voltage. The top knob is the vernier adjustment of the sensitivity. When it is fully-clockwise, the sensitivity is calibrated.
- D-5 Vertical mode switch This is the choice for vertical display mode.
- D-6 Connectors for oscilloscope GND: This the ground jack of the oscilloscope chassis.
- D-7 Vertical position control This adjusts the position of a waveform from channel 2 in the vertical direction.
- D-8 AC-Ground-DC switch for CH2 This is the coupling switch for channel 2 input. Refer to D-2 for the explanation of each position.
- D-9 Input jack for CH2 This is the BNC connector to be connected to the measuring probes for channel 2.
- D-10 Volts/Div control for CH2 This function is exactly the same as the one for channel 1. Refer to the explanation in D-4.
Ground (GND): This provides a zero-volt base line.
DC: This gives direct coupling of the signal.
CH1: This lets the channel-1 input display.
CH2/X-Y
CH1: This lets the channel-2 input display.
X-Y: This is used with the X-Y control and trigger source (B-3).
DUAL: This displays both signals from channels 1 and 2.
ADD: This displays the summed signals of channels 1 and 2.
CAL terminal: This provides a square wave signal to check the probe compensation adjustment and vertical calibration.
Section E: Control for time calibration and related adjustment
- E-1 Variable sweep control This is the vernier adjustment for sweep rate.
- E-2 Time/Div control This gives the step selection of sweep rate to change the time scales in the horizontal direction.
- E-3 External trigger jack This is the external jack for single- and dual-trace operation of the input.
How to measure with an oscilloscope
The basic procedure
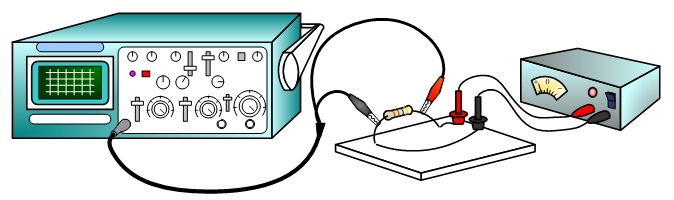
The basic controls of an oscilloscope have been explained in the above section. Now, we will start measuring circuit signals as follows:- Provide an electric circuit and make the probes (coaxial cable) connected to the BNC connector on an oscilloscope.
- Clip with the ground probe and the measuring probe across a circuit element as shown in the figure above.
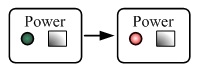
- Turn on the oscilloscope and the circuit with a proper power supply.
- Check if the selection in the vertical control (D-5) matches the connected channel.
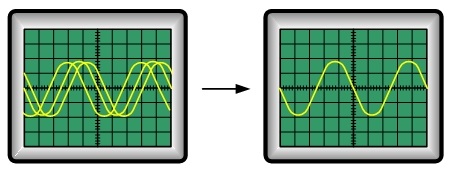
- Use the trigger level (B-1 and B-2) if the waveform keeps on moving in the display as shown above. This can stabilize the waveform.
- Select an appropriate VOLTS/DIV control so you can have a proper waveform in the display. This should be as large as possible so you can measure the values accurately. The VOLTS/DIV control allows you to change how many volts are represented by each vertical increment of division overlay on the display. Essentially, this can zoom in and out the signal from the circuit along the y axis.
- Measure the number of divisions in the vertical direction from the top peak to the bottom peak. Then, multiply by the indicated value in VOLTS/DIV to calculate the peak to peak voltage. After dividing it by two, you can have the voltage amplitude of the waveform.
- Find the period by measuring the horizontal distance for one cycle of the waveform. Then, multiply the indicated value in TIME/DIV control to obtain the period. The TIME/DIV control can change the horizontal increment of the division overlay on the display.
Examples for voltage and period measurement
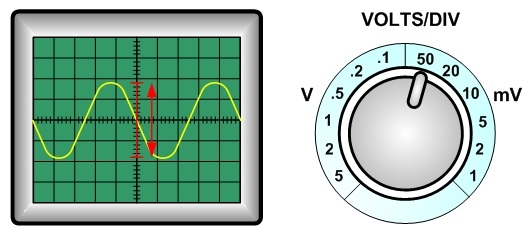
The procedure 6 to 8 above are the most important steps when finding the physical values of a circuit. After adjusting the waveform of the circuit signal, you are supposed to obtain the following display:Then, according to the VOLTS/DIV control, it indicates "50 mV" as the factor of multiplication. Please watch out the units. "mV" means one thousandth of a volt.
Therefore, the peak-to-peak voltage is calculated as 3.60 div. × 50 × 0.001, which is equal to 0.18 volts.
However, this is NOT the voltage detected in the circuit yet. The amplitude of the waveform is the correspondent voltage, so 0.18 volts have to be divided by 2. The voltage amplitude is found out to be 0.090 volts or 90 millivolts.
A waveform in general repeats one unit of a shape that is called a cycle. Then, the time for one cycle is defined as the period.
For example, you can see the period as the x-range with the red arrow in the figure. The number of division can be counted in the same way as 4.00 div. + 0.50 div(left fraction) + 0.60 div.(right fraction) = 5.10 div.
The TIME/DIV control indicates 50 micro seconds, so the period is computed as 5.10 div. × 50 × 10-6 (or 0.000001) which gives 2.55×10⁻⁴ seconds or 0.000255 seconds. (This could be rounded as 2.6×10⁻⁴ s.)
In addition, the frequency can be obtained by calculating 1 ÷ period. Thus, we have 1 ÷ 0.000255 = 3920 Hz ∼ 3900 Hz as the frequency of the signal.
Practice for the voltage and period measurements
Need help?Yes!