Outline:
Range
Border
Zero axes
Key
Tics
Major tics
Minor tics
Nomirror and second tics
Other options for tics
Grid
Want only the plot?
Title, key title, and lable
Title
Key title
Label
Arrow
Resolution
3D Plot general
Scaling
Size ratio
Tics level
Log scale
Parameterizing
Parametric
Polar
Border
Zero axes
Key
Tics
Major tics
Minor tics
Nomirror and second tics
Other options for tics
Grid
Want only the plot?
Title, key title, and lable
Title
Key title
Label
Arrow
Resolution
3D Plot general
Scaling
Size ratio
Tics level
Log scale
Parameterizing
Parametric
Polar
Data plot
Basics
Vector
Bar graph
Line and point styles
Multiple columns data plot
Multiplot
For CSV files
For Fortran high precision data
Error bars
Candle chart
3D data plot
Other tips
Define a function
Plot with complex variables
Tertiary operator
Skip data values
Gnuplot as a calculator
Timestamp
Data fitting
Range
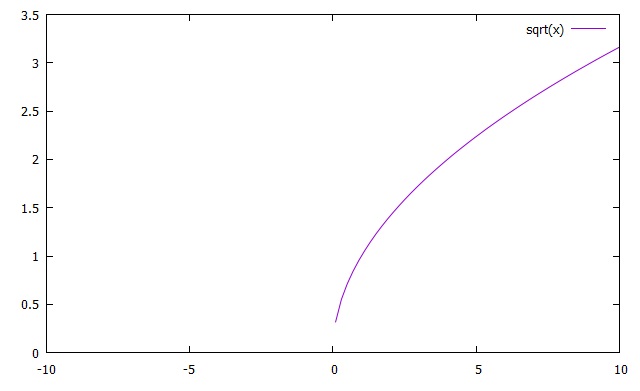
You can set or unset various items for displaying your plot. If you want to show some item, command like, "set *****". If you want to remove or undo it, "unset *****". In most of the cases, you can control woth "set" or "unset" to show or hide.Now, let's get started with plotting √ x. Start up gnuplot first, then enter:
gnuplot> plot sqrt(x)
You will see the output as follows:
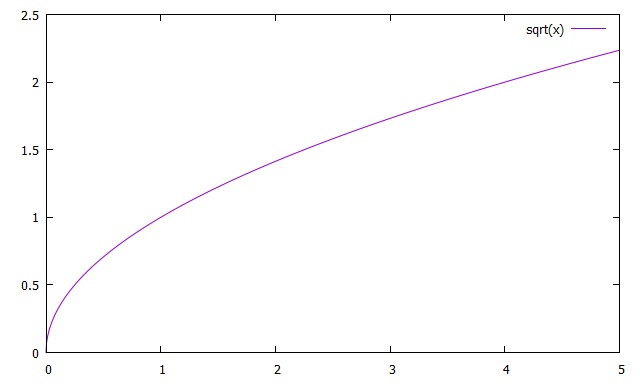
gnuplot> set xrange[0:5]
gnuplot> plot sqrt(x)
gnuplot> plot sqrt(x)
gnuplot> unset xrange
or
gnuplot> set autoscale
Also, the following arrangement is equivalent with the previous setting for x-range. You can include
the range setting into the plot command. The first and the second arguments are addressed to x and y ranges, respectively.
or
gnuplot> set autoscale
gnuplot> plot [0:5] [] sqrt(x)
If you do not need to set the y-range, you can omit to type. However, if you set only y range, you should do as follows:
gnuplot> plot [] [0:5] sqrt(x)
If you want to set only the end of the range, you can do as follows:
gnuplot> set xr [:8]
| Previous page | Next page |