Outline:
Range
Border
Zero axes
Key
Tics
Major tics
Minor tics
Nomirror and second tics
Other options for tics
Grid
Want only the plot?
Title, key title, and lable
Title
Key title
Label
Arrow
Resolution
3D Plot general
Scaling
Size ratio
Tics level
Log scale
Parameterizing
Parametric
Polar
Border
Zero axes
Key
Tics
Major tics
Minor tics
Nomirror and second tics
Other options for tics
Grid
Want only the plot?
Title, key title, and lable
Title
Key title
Label
Arrow
Resolution
3D Plot general
Scaling
Size ratio
Tics level
Log scale
Parameterizing
Parametric
Polar
Data plot
Basics
Vector
Bar graph
Line and point styles
Multiple columns data plot
Multiplot
For CSV files
For Fortran high precision data
Error bars
Candle chart
3D data plot
Other tips
Define a function
Plot with complex variables
Tertiary operator
Skip data values
Gnuplot as a calculator
Timestamp
Data fitting
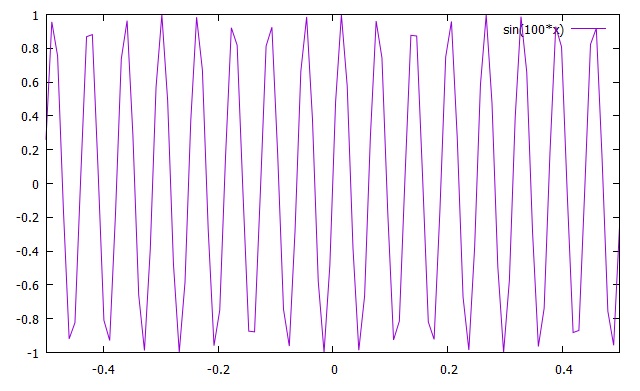
Resolution
Let's plot sin(100*x) without any option.
gnuplot> plot sin(100*x)
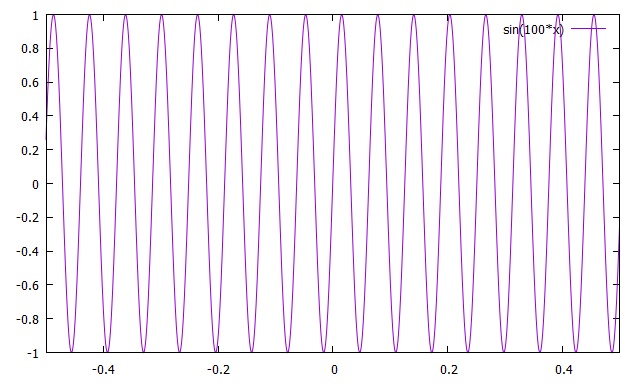
gnuplot> set samples 1000
gnuplot> plot sin(100*x)
gnuplot> plot sin(100*x)
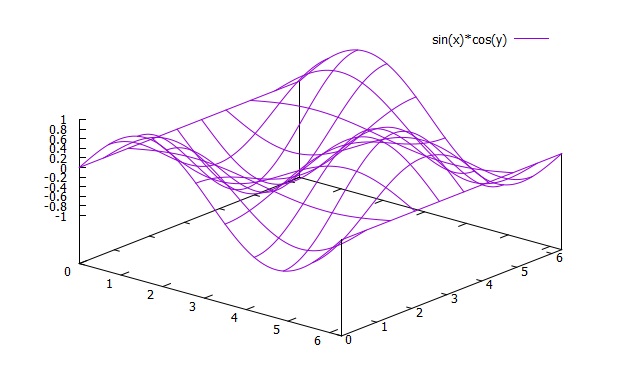
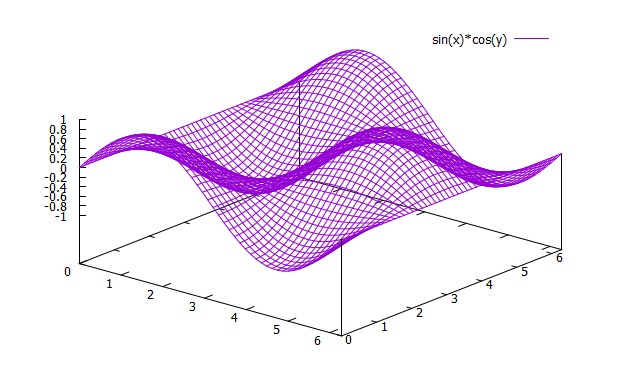
For a 3D plot, use isosamples instead of samples. The default is 10, so let's try 50. (The detailed instruction for 3D plots will be given in the next section.)
gnuplot> set isosamples 50
gnuplot> splot [0:2*pi] [0:2*pi] sin(x)*cos(y)
gnuplot> splot [0:2*pi] [0:2*pi] sin(x)*cos(y)
| Previous page | Next page |