Outline:
Range
Border
Zero axes
Key
Tics
Major tics
Minor tics
Nomirror and second tics
Other options for tics
Grid
Want only the plot?
Title, key title, and lable
Title
Key title
Label
Arrow
Resolution
3D Plot general
Scaling
Size ratio
Tics level
Log scale
Parameterizing
Parametric
Polar
Border
Zero axes
Key
Tics
Major tics
Minor tics
Nomirror and second tics
Other options for tics
Grid
Want only the plot?
Title, key title, and lable
Title
Key title
Label
Arrow
Resolution
3D Plot general
Scaling
Size ratio
Tics level
Log scale
Parameterizing
Parametric
Polar
Data plot
Basics
Vector
Bar graph
Line and point styles
Multiple columns data plot
Multiplot
For CSV files
For Fortran high precision data
Error bars
Candle chart
3D data plot
Other tips
Define a function
Plot with complex variables
Tertiary operator
Skip data values
Gnuplot as a calculator
Timestamp
Data fitting
Parameterizing
Parametric
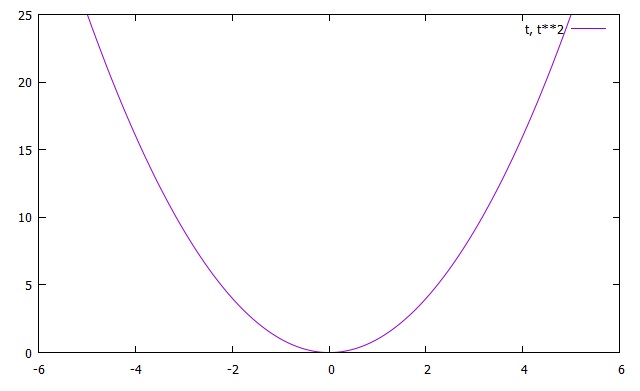
For the parametric plots, use "set parametric." Then, you will have a message, "dummy variable is t for curves, u/v for surfaces." Namely, you are allowed to use "t" for 2D parametric plots, and "u" and "v" for 3D parametric plots.Let's plot a curve with x = t and y = t2.
gnuplot> set parametric
gnuplot> plot t, t**2
gnuplot> plot t, t**2
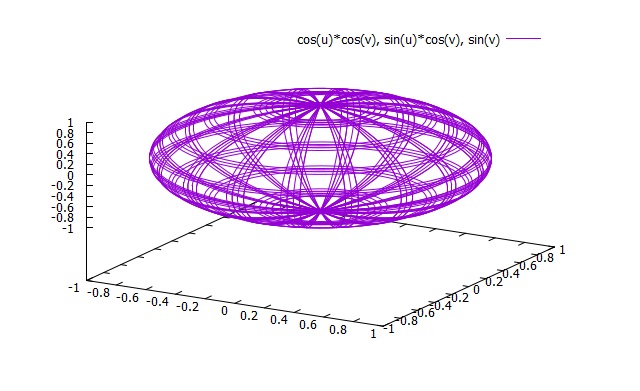
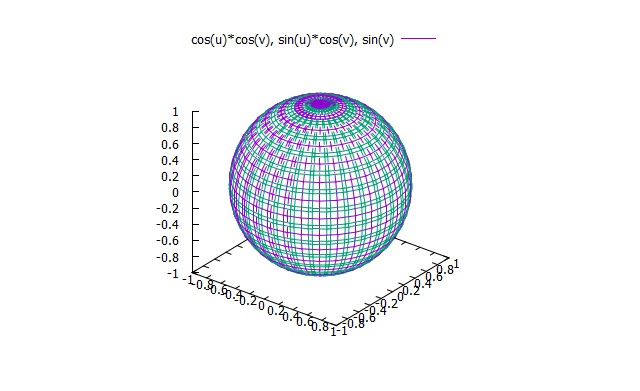
gnuplot> set parametric
gnuplot> splot cos(u)*cos(v),sin(u)*cos(v),sin(v)
gnuplot> splot cos(u)*cos(v),sin(u)*cos(v),sin(v)
Polar
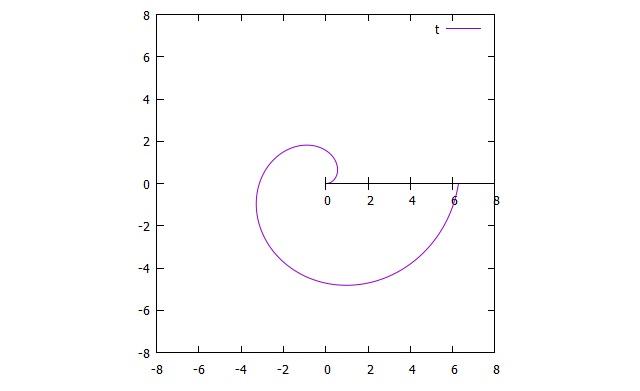
It is similar to the parametric option. The dummy parameter, t, represents the angle in radians. The 3D plot is not available for this option. Let's plot the following example:
gnuplot> set polar
gnuplot> plot t
gnuplot> plot t
gnuplot> set polar
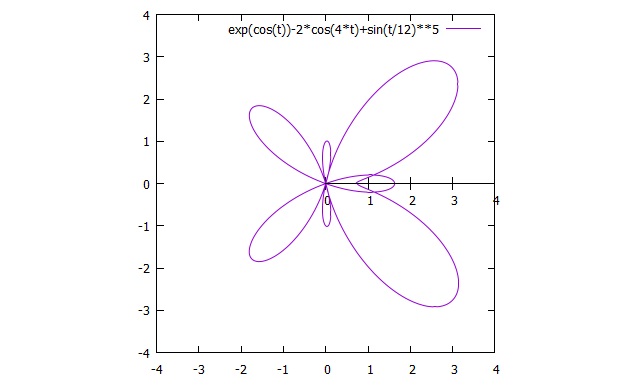
gnuplot> plot exp(cos(t))-2*cos(4*t)+(sin(t/12))**5
gnuplot> plot exp(cos(t))-2*cos(4*t)+(sin(t/12))**5
| Previous page | Next page |