Outline:
Range
Border
Zero axes
Key
Tics
Major tics
Minor tics
Nomirror and second tics
Other options for tics
Grid
Want only the plot?
Title, key title, and lable
Title
Key title
Label
Arrow
Resolution
3D Plot general
Scaling
Size ratio
Tics level
Log scale
Parameterizing
Parametric
Polar
Border
Zero axes
Key
Tics
Major tics
Minor tics
Nomirror and second tics
Other options for tics
Grid
Want only the plot?
Title, key title, and lable
Title
Key title
Label
Arrow
Resolution
3D Plot general
Scaling
Size ratio
Tics level
Log scale
Parameterizing
Parametric
Polar
Data plot
Basics
Vector
Bar graph
Line and point styles
Multiple columns data plot
Multiplot
For CSV files
For Fortran high precision data
Error bars
Candle chart
3D data plot
Other tips
Define a function
Plot with complex variables
Tertiary operator
Skip data values
Gnuplot as a calculator
Timestamp
Data fitting
Tics
Major tics
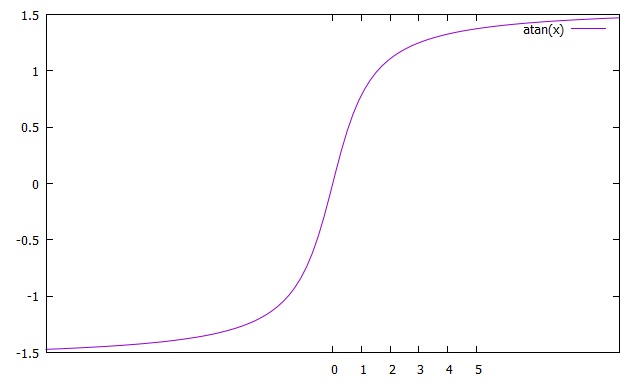
"Tics" takes three arguments, which are <start point>, <increment>, and <end point>, respectively. Namely, if you type as follows, you will see the picture below.
gnuplot> set xtics 0, 1, 5
gnuplot> plot atan(x)
gnuplot> plot atan(x)
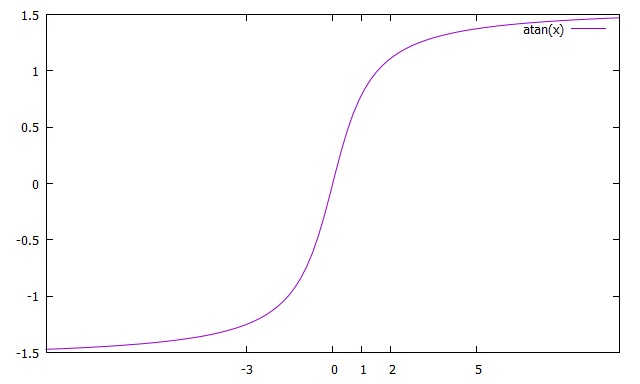
You can also choose several tics randomly.
gnuplot> gnuplot> set xtics (-3,0,1,2,5)
gnuplot> plot atan(x)
gnuplot> plot atan(x)
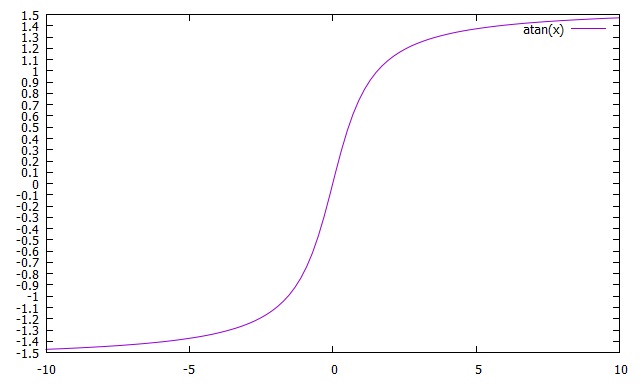
gnuplot> set ytics 0.1
gnuplot> plot atan(x)
gnuplot> plot atan(x)
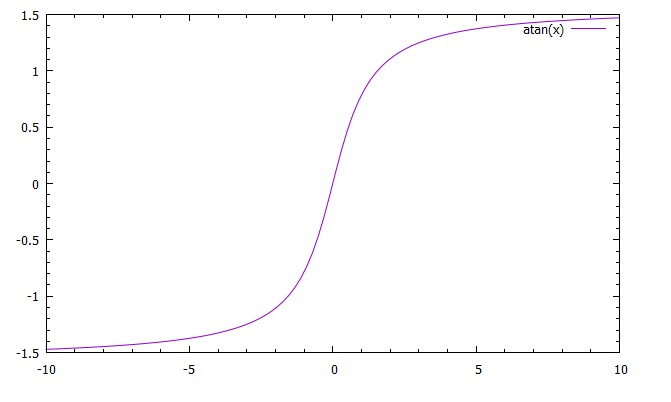
gnuplot> unset tics
In ordert to turn on all of the tics, use
gnuplot> set tics
You can specify tics for each axis such as xtics, ytics, and ztics. However,
you cannot use any argument for "set tics." For instance, "set tics 2" is not allowed.
Minor tics
You can also set the minor tics. The argument indicates the number of intervals. Each axis has to be set independently.
gnuplot> set mxtics 5
gnuplot> set mytics 5
gnuplot> plot atan(x)
gnuplot> set mytics 5
gnuplot> plot atan(x)
Nomirror and second tics
The tics are reflected on the other sides as you can see. When you use "nomirror" option, the other side of tics will be removed.
gnuplot> set ytics nomirror
gnuplot> plot sin(x)**2/x**2
gnuplot> plot sin(x)**2/x**2
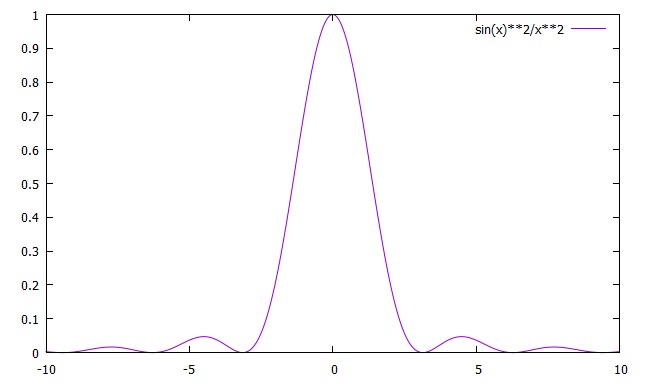
 If you want to undo it, enter "set ytics mirror."
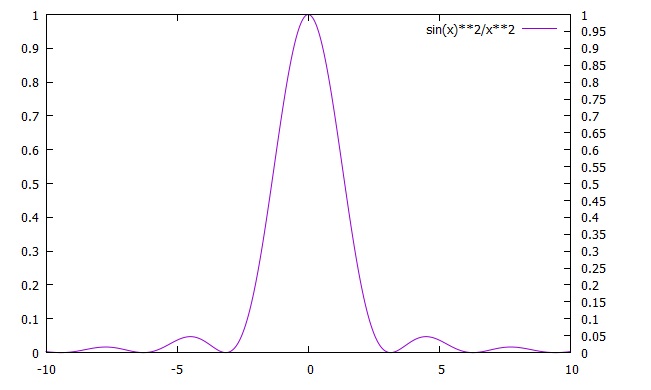
After removing tics like the above, the other scale of the tics can be replaced. Simply enter following:
gnuplot> set y2tics 0.05
gnuplot> plot sin(x)**2/x**2
gnuplot> plot sin(x)**2/x**2
Other options for tics
There are several more options for "set tics."
gnuplot> set tics axis #Put tics on axes
gnuplot> set tics out #Put tics outside
gnuplot> set tics in #Put tics inside
gnuplot> set tics rotate #rotate tics numbers by 90 degrees
gnuplot> set xdtics #Put days on tics (for y- and z-axes, use ydtics and zdtics)
gnuplot> set xmtics #Put months on tics (for y- and z-axes, use ymtics and zmtics)
| Previous page | Next page |