Outline:
Range
Border
Zero axes
Key
Tics
Major tics
Minor tics
Nomirror and second tics
Other options for tics
Grid
Want only the plot?
Title, key title, and lable
Title
Key title
Label
Arrow
Resolution
3D Plot general
Scaling
Size ratio
Tics level
Log scale
Parameterizing
Parametric
Polar
Border
Zero axes
Key
Tics
Major tics
Minor tics
Nomirror and second tics
Other options for tics
Grid
Want only the plot?
Title, key title, and lable
Title
Key title
Label
Arrow
Resolution
3D Plot general
Scaling
Size ratio
Tics level
Log scale
Parameterizing
Parametric
Polar
Data plot
Basics
Vector
Bar graph
Line and point styles
Multiple columns data plot
Multiplot
For CSV files
For Fortran high precision data
Error bars
Candle chart
3D data plot
Other tips
Define a function
Plot with complex variables
Tertiary operator
Skip data values
Gnuplot as a calculator
Timestamp
Data fitting
Other tips
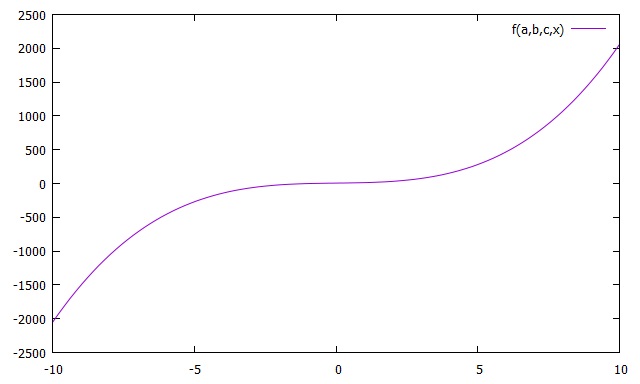
Define a function
In order to define your own function, enter as follows:
gnuplot> f(a,b,c,x)=a*x**3+b*x+c
gnuplot> a = 2
gnuplot> b = 5
gnuplot> c = 7
gnuplot> plot f(a,b,c,x)
gnuplot> a = 2
gnuplot> b = 5
gnuplot> c = 7
gnuplot> plot f(a,b,c,x)
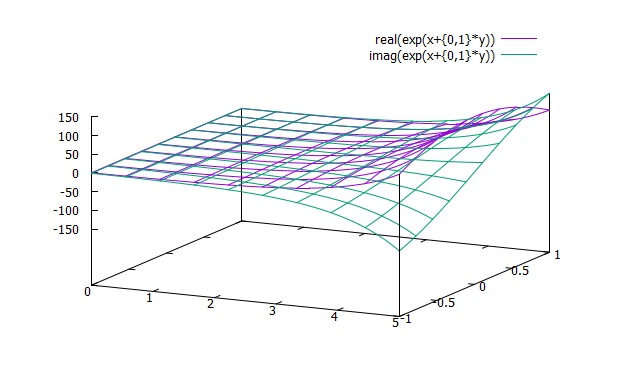
Plot with complex variables
Complex variables are expressed with curly brackets. For instance, the imaginary number is: i = {0, 1}; and 3.0 + 2.0i can be {3.0, 2.0}. Let's plot an example.
gnuplot> i = {0, 1}
gnuplot> splot real(exp(x+i*y)), imag(exp(x+i*y))
gnuplot> splot real(exp(x+i*y)), imag(exp(x+i*y))
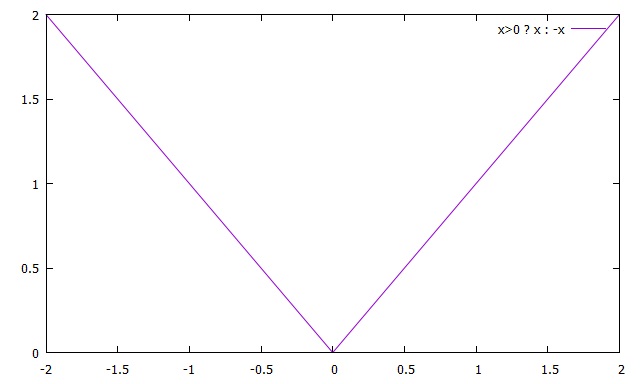
Tertiary operator
This command can be seen in other programming languages. It is usually expressed as "(condition) ? (command 1) : (command 2)." Command 1 is executed when the condition is true; otherwise, command 2 is executed. Let's do this with gnuplot.
gnuplot> plot x>0 ? x : -x
This means that if x is greater than 0, plot f(x) = x; otherwise, plot f(x) = -x.
Skip data values
You can skip the data values and the data blocks with a gnuplot command, "every." For example, here is a set of data, skip.d
1 2 # line 0
2 3 # line 1
3 4 # line 2 block 0
4 5 # line 3
5 6 # line 4
6 3 # line 0
7 4 # line 1
8 5 # line 2 block 1
9 6 # line 3
10 7 # line 4
11 4 # line 0
12 5 # line 1
13 6 # line 2 block 2
14 7 # line 3
15 8 # line 4
Each line and block number is indicated as above. The "every" command controls each of them by taking
6 arguments. For example,
2 3 # line 1
3 4 # line 2 block 0
4 5 # line 3
5 6 # line 4
6 3 # line 0
7 4 # line 1
8 5 # line 2 block 1
9 6 # line 3
10 7 # line 4
11 4 # line 0
12 5 # line 1
13 6 # line 2 block 2
14 7 # line 3
15 8 # line 4
gnuplot> plot 'skip.d' every 2:1:2:4:0:1
Here is the explanation of each argument.
| 1st arg. | 2nd arg. | 3rd arg. | 4th arg. | 5th arg. | 6th arg. |
| Skip the line "every #ed or #th." (0 and 1 do nothing for this part.) | Skip the block "every #ed or #th." (0 and 1 do nothing for this part.) | Specify the start line "labeled." | Specify the start block "labeled." | Specify the end line "labeled." | Specify the end block "labeled." |
Choosing numbers is a little tricky. In the above table, "every #ed or #th" means that if you choose 2, it will skip every 2nd data line or block. You may try and get used to the manipulation by yourself.
Gnuplot as a calculator
Gnuplot can also return a calculated values. Use "print" command.
gnuplot> print atan(0.6)/sin(3.0)
3.829503042838
You can use any built-in functions and operators to calculate with plugged-in values.
3.829503042838
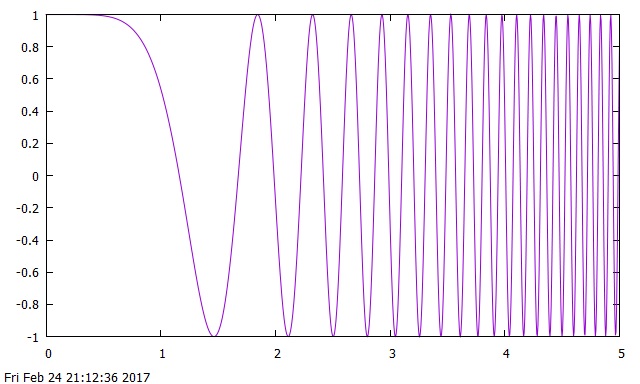
Timestamp
If you use the following command, you can have a timestamp for the output.
gnuplot> set time
gnuplot> plot cos(x**3)
gnuplot> plot cos(x**3)
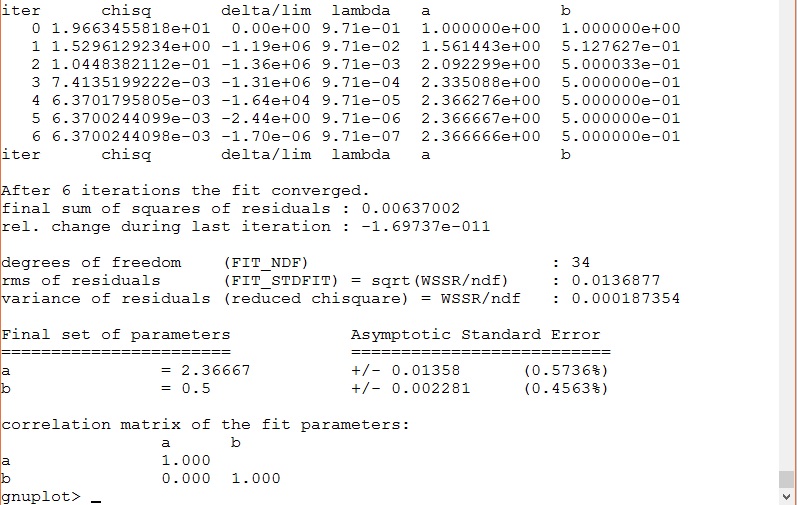
Data fitting
Gnuplot can also generate data fitting parameters. Let's try an interesting example. Here is numerical data from the error function, erf.d. We attempt to fit them with a function, atan(x)/a + b, which a and b are parameters to be obtained. Enter as follows:
gnuplot> f(x)=atan(x)/a+b
gnuplot> fit f(x) 'erf.d' via a,b
Then, you will have the following output:
gnuplot> fit f(x) 'erf.d' via a,b
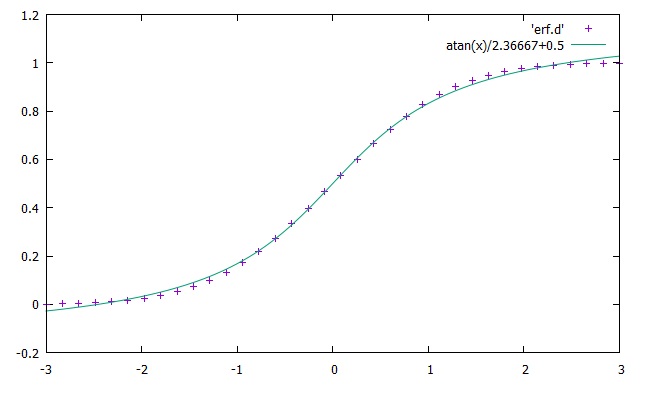
gnuplot> plot 'erf.d', atan(x)/2.36667+0.5
NOTE: If you have a set of data separated by commas, you need to type this on gnuplot:
gnuplot> set datafile separator ","
If the data are separated by tabs, you will use the following setting to read the file:
gnuplot> set datafile separator "\t"
| Previous page |