Outline:
Range
Border
Zero axes
Key
Tics
Major tics
Minor tics
Nomirror and second tics
Other options for tics
Grid
Want only the plot?
Title, key title, and lable
Title
Key title
Label
Arrow
Resolution
3D Plot general
Scaling
Size ratio
Tics level
Log scale
Parameterizing
Parametric
Polar
Border
Zero axes
Key
Tics
Major tics
Minor tics
Nomirror and second tics
Other options for tics
Grid
Want only the plot?
Title, key title, and lable
Title
Key title
Label
Arrow
Resolution
3D Plot general
Scaling
Size ratio
Tics level
Log scale
Parameterizing
Parametric
Polar
Data plot
Basics
Vector
Bar graph
Line and point styles
Multiple columns data plot
Multiplot
For CSV files
For Fortran high precision data
Error bars
Candle chart
3D data plot
Other tips
Define a function
Plot with complex variables
Tertiary operator
Skip data values
Gnuplot as a calculator
Timestamp
Data fitting
3D Plot General
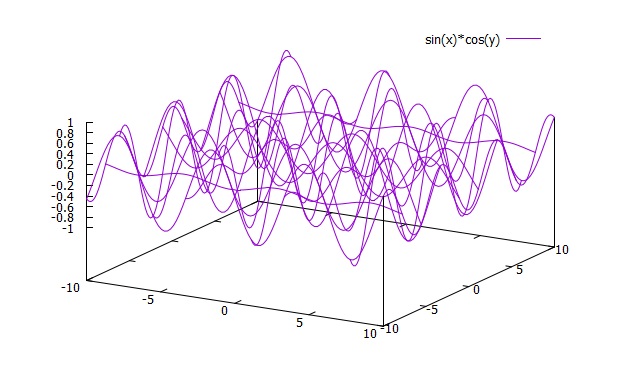
For 3D plots, the functions generally consist of both x and y. The command must be "splot" instead of "plot." You may need to set options for z axis, such as range, zeroaxis, etc. The way you set is exactly the same as x- and y-axes. The simplest command line is as follows:
gnuplot> splot sin(x)*cos(y)
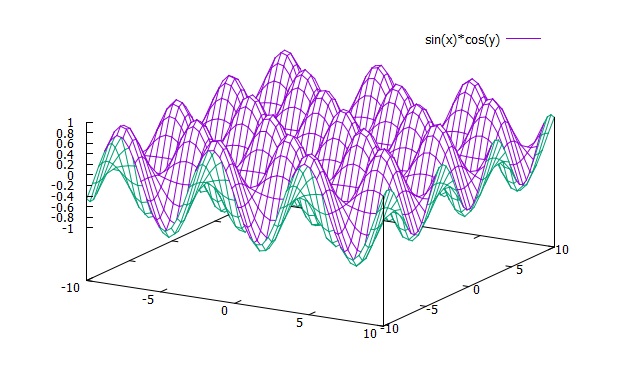
gnuplot> set hidden3d
gnuplot> splot sin(x)*cos(y)
Note that the picture below uses isosamples 50.
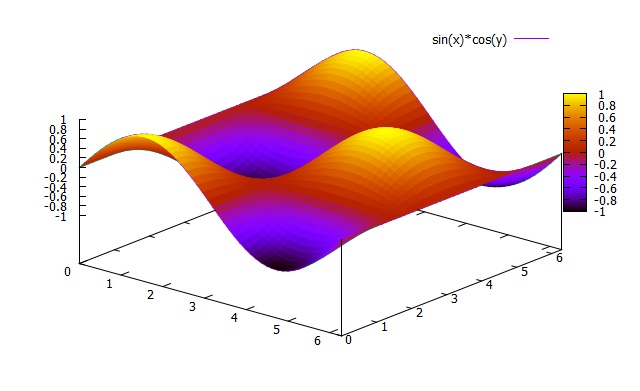
gnuplot> splot sin(x)*cos(y)
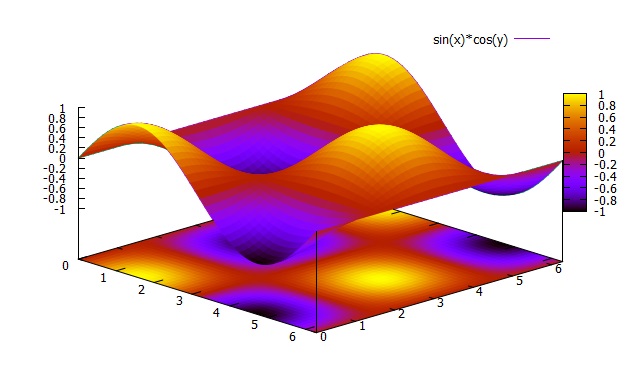
gnuplot> set pm3d
gnuplot> splot [0:2*pi] [0:2*pi] sin(x)*cos(y)
gnuplot> splot [0:2*pi] [0:2*pi] sin(x)*cos(y)
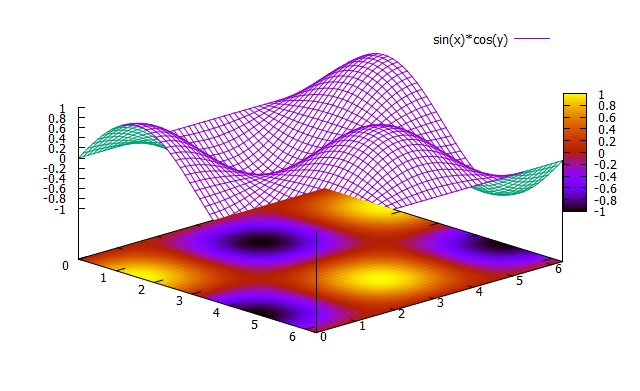
gnuplot> set pm3d at b
gnuplot> splot [0:2*pi] [0:2*pi] sin(x)*cos(y)
gnuplot> splot [0:2*pi] [0:2*pi] sin(x)*cos(y)
gnuplot> set pm3d at bs
gnuplot> splot [0:2*pi] [0:2*pi] sin(x)*cos(y)
gnuplot> splot [0:2*pi] [0:2*pi] sin(x)*cos(y)
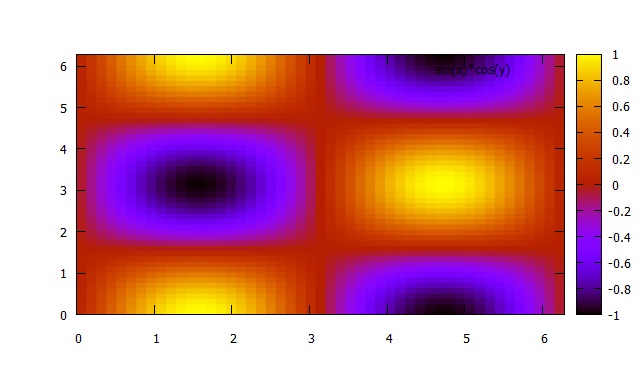
gnuplot> set pm3d map
gnuplot> splot [0:2*pi] [0:2*pi] sin(x)*cos(y)
gnuplot> splot [0:2*pi] [0:2*pi] sin(x)*cos(y)
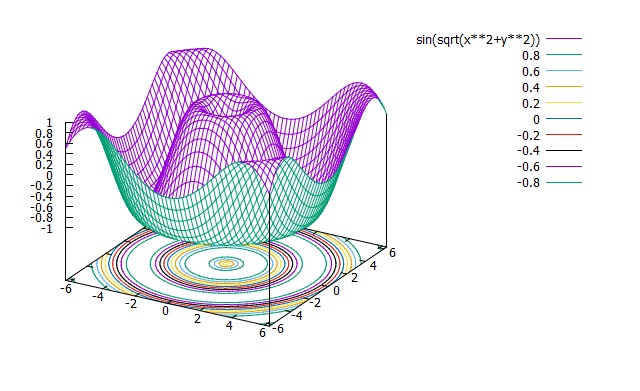
gnuplot> set contour
gnuplot> splot sin(sqrt(x**2+y**2))
gnuplot> splot sin(sqrt(x**2+y**2))
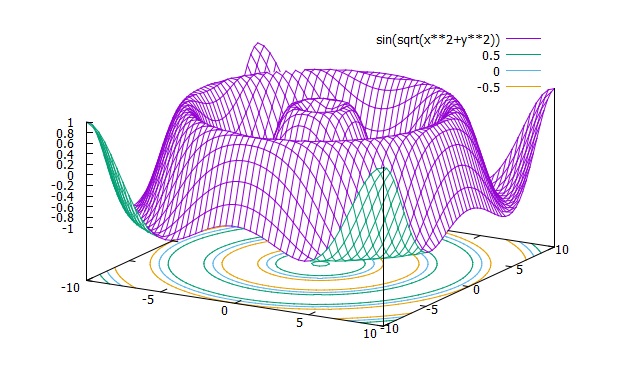
gnuplot> set cntrparam levels 10
gnuplot> splot sin(sqrt(x**2+y**2))
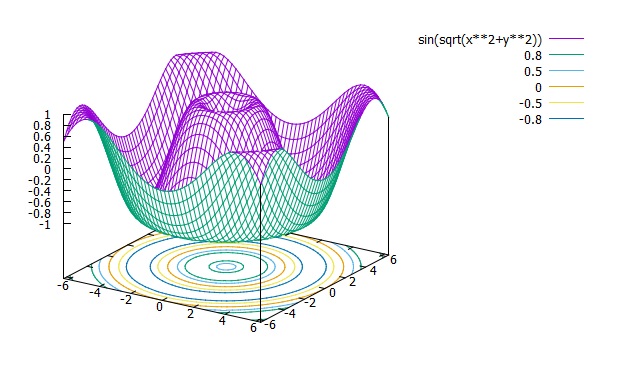
gnuplot> splot sin(sqrt(x**2+y**2))
gnuplot> set cntrparam levels discrete -0.8,-0.5,0,0.5,0.8
gnuplot> splot sin(sqrt(x**2+y**2))
gnuplot> splot sin(sqrt(x**2+y**2))
| Previous page | Next page |