Outline:
Range
Border
Zero axes
Key
Tics
Major tics
Minor tics
Nomirror and second tics
Other options for tics
Grid
Want only the plot?
Title, key title, and lable
Title
Key title
Label
Arrow
Resolution
3D Plot general
Scaling
Size ratio
Tics level
Log scale
Parameterizing
Parametric
Polar
Border
Zero axes
Key
Tics
Major tics
Minor tics
Nomirror and second tics
Other options for tics
Grid
Want only the plot?
Title, key title, and lable
Title
Key title
Label
Arrow
Resolution
3D Plot general
Scaling
Size ratio
Tics level
Log scale
Parameterizing
Parametric
Polar
Data plot
Basics
Vector
Bar graph
Line and point styles
Multiple columns data plot
Multiplot
For CSV files
For Fortran high precision data
Error bars
Candle chart
3D data plot
Other tips
Define a function
Plot with complex variables
Tertiary operator
Skip data values
Gnuplot as a calculator
Timestamp
Data fitting
Title, key title, and lable
Title
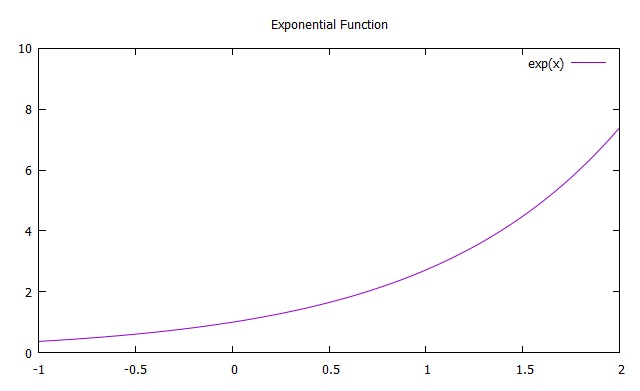
In order to make a title for a plot,
gnuplot> set title "Exponential Function"
gnuplot> plot exp(x)
gnuplot> plot exp(x)
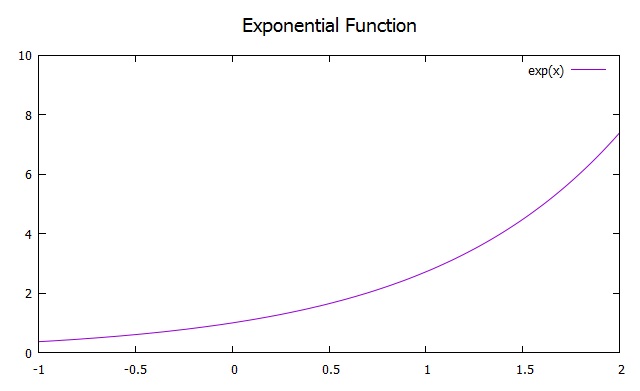
gnuplot> set title font "Helvetica,14"
gnuplot> plot exp(x)
The value, 14, is the size of the font.
gnuplot> plot exp(x)
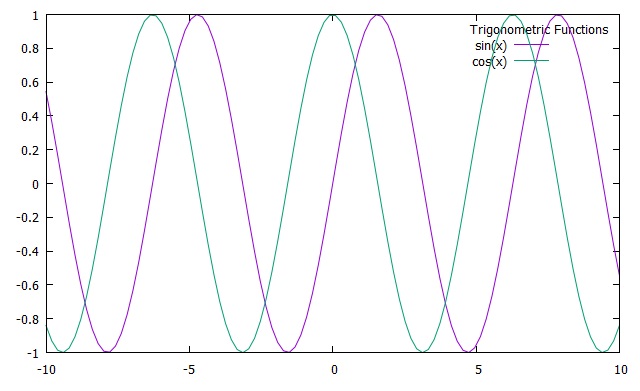
Key Title
If you have several functions to plot and put a title for the entire keys, use "key title." Let's try some example. There are two functions, sin(x) and cos(x). Then, the key title can be "Trigonometric Functions."
gnuplot> set key title "Trigonometric Functions"
gnuplot> plot sin(x), cos(x)
gnuplot> plot sin(x), cos(x)
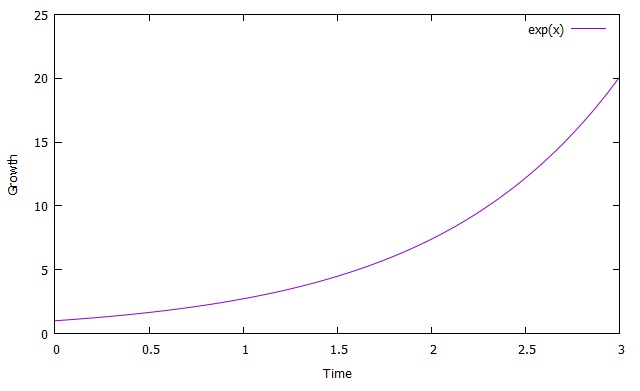
Lable
For labels of each axis, you have the command as follows:
gnuplot> set xlabel "Time"
gnuplot> set ylabel "Growth"
gnuplot> plot exp(x)
gnuplot> set ylabel "Growth"
gnuplot> plot exp(x)
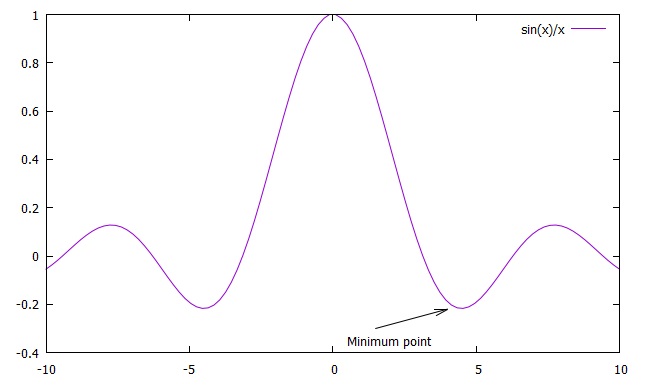
Arrow
An arrow can be displayed in the graph to indicate a place to note. The values of coordinate must be based on the plot ranges as default. Let's give an example:
gnuplot> set label 'Minimum point' at 0.5,-0.35
gnuplot> set arrow from 1.5,-0.3 to 4,-0.22
gnuplot> plot sin(x)/x
gnuplot> set arrow from 1.5,-0.3 to 4,-0.22
gnuplot> plot sin(x)/x
| Previous page | Next page |