Outline:
Range
Border
Zero axes
Key
Tics
Major tics
Minor tics
Nomirror and second tics
Other options for tics
Grid
Want only the plot?
Title, key title, and lable
Title
Key title
Label
Arrow
Resolution
3D Plot general
Scaling
Size ratio
Tics level
Log scale
Parameterizing
Parametric
Polar
Border
Zero axes
Key
Tics
Major tics
Minor tics
Nomirror and second tics
Other options for tics
Grid
Want only the plot?
Title, key title, and lable
Title
Key title
Label
Arrow
Resolution
3D Plot general
Scaling
Size ratio
Tics level
Log scale
Parameterizing
Parametric
Polar
Data plot
Basics
Vector
Bar graph
Line and point styles
Multiple columns data plot
Multiplot
For CSV files
For Fortran high precision data
Error bars
Candle chart
3D data plot
Other tips
Define a function
Plot with complex variables
Tertiary operator
Skip data values
Gnuplot as a calculator
Timestamp
Data fitting
Scaling
Size ratio
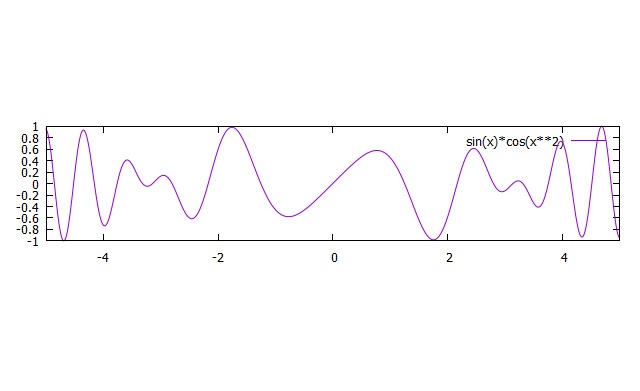
If you want to use the actual scale ratio for an x- and y-coordinate, use "set size ratio." Suppose the x range is from -5 to 5 that is a length of 10; the y range is from -1 to 1 that is a length of 2. The ratio between them should be y/x = 2/10 = 0.2. Therefore, you enter
gnuplot> set size ratio 0.2
gnuplot> plot [-5:5][-1:1] sin(x)*cos(x**2)
gnuplot> plot [-5:5][-1:1] sin(x)*cos(x**2)
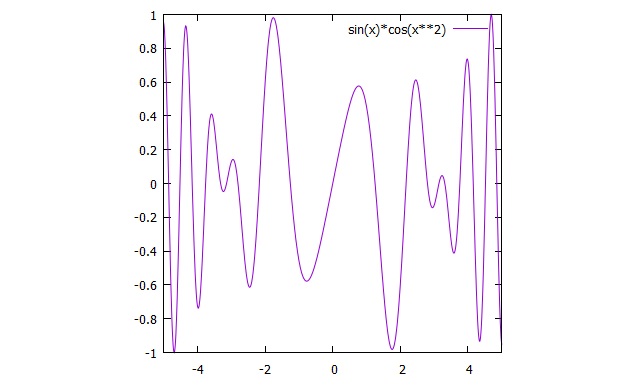
gnuplot> set size square
or
gnuplot> set size ratio 1
Then, you have
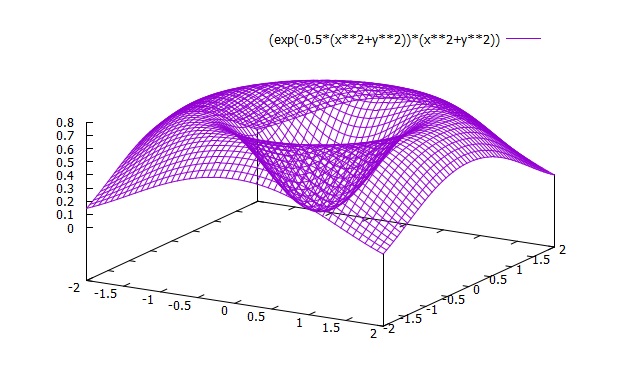
gnuplot> set view equal xyz
gnuplot> splot [-2:2] [-2:2] exp(-0.5*(x**2+y**2))*(x**2+y**2)
gnuplot> splot [-2:2] [-2:2] exp(-0.5*(x**2+y**2))*(x**2+y**2)
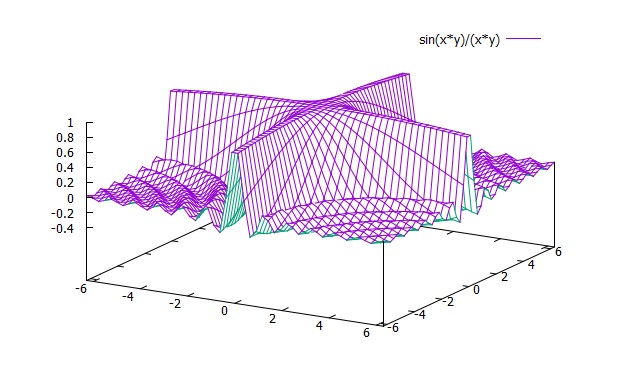
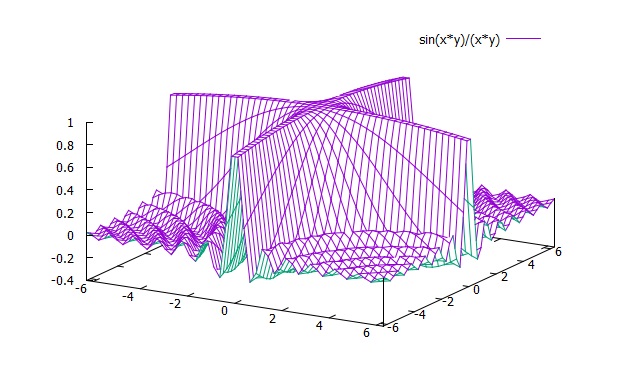
Tics level
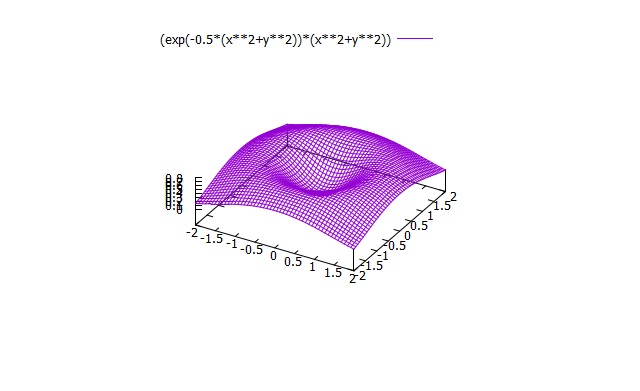
The default 3D-plot often raises the bottom of the graph to be seen better. If you don't need such arrangement, use "set ticslevel 0."
gnuplot> set ticslevel 0
gnuplot> splot [-2*pi:2*pi] [-2*pi:2*pi] sin(x*y)/(x*y)
gnuplot> splot [-2*pi:2*pi] [-2*pi:2*pi] sin(x*y)/(x*y)
Log scale
In order to set logscales for all the axes, enter following:
gnuplot> set logscale
If you specify an axis to make logscale, put the name of axis after "set logscale" as follows:
gnuplot> set logscale y
If you need to undo the scales, simply use "unset logscale."
gnuplot> unset logscale
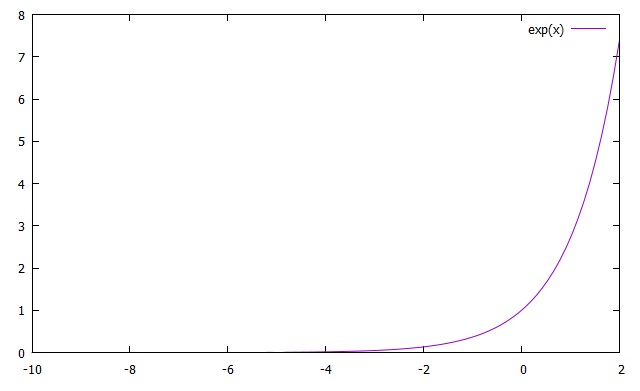
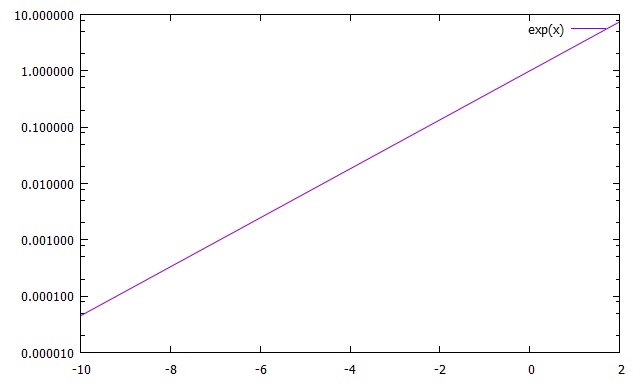
Let's plot exp(x) with the normal scale; and then, set log scale for y axis and replot it.
gnuplot> set logscale y
gnuplot> plot [:2] exp(x)
gnuplot> plot [:2] exp(x)
| Previous page | Next page |